

|

|

|

|
|
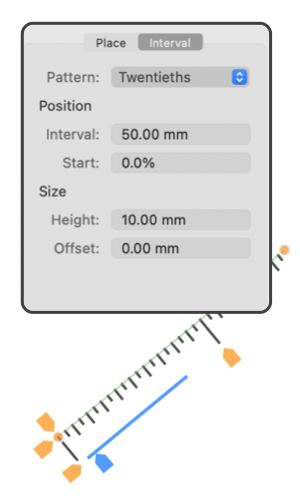
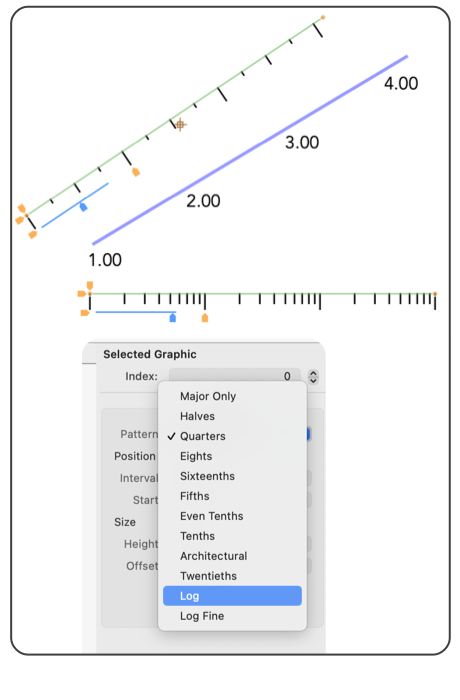
Axis Tick Marks This tab view provides inspection and input used with the Axis Tick Marks. A Tick Mark graphic is a composite graphic that consists of a sequence of short lines drawn perpendicular to an axis line. Several patterns of tick marks are provided. The parameters here control selection of the pattern, and lengths of the ticks as well a precise positioning of the ticks. Tick marks are drawn using the tools found near the bottom of the Technical Tools palette which is opened from the View Main menu. The example to the left shows the contents of the Graphic Details Inspector when a Tick Mark graphic is selected and Graphic Details Inspector is in use. To view this information use the Graphic Details menu command found on the Tools main menu.

Grid elements is used in conjunction with Tick Marks and Text Label sequences to assemble the elements of a chart or graph. The elements are provided as independent tools for maximum flexibility in designing graphing components. The Outline parameter of the Color and Style associated with a tick applies to the actual ticks. It is not possible to draw the axis and the ticks with the single tick mark graphic. A second line needs to be drawn if you want a visible axis. This is because the Tick Marks are often used with a Grid, and the axis line can be drawn with the Grid rather than the tick. Use Snap Vertices to conveniently add a line that exactly corresponds to the axis. These tick patterns look like rulers, but they do not work as rulers for measuring distances on your drawing. If rulers are needed us the Tape Cursor tool or perhaps an Auto-line or dimensioning graphic. |