|
|

|
|
Graphing and Charting: Axes, Grids, Labels, and Tick Marks
These tools are used to create the component elements of a graph or chart. Each tool provides convenient design and adjustment of the axes, labels, and grid of a chart.
The components are provided individually to allow a greater degree of flexibility in the design and appearance. EazyDraw is not a charting application, so we are not providing a "canned" chart and there is no mechanism in EazyDraw to enter a table of data and automatically generate a graph or chart. Other applications are available for these tasks.
These graphics normally appear on a larger scale. It is advisable to zoom-out before drawing. This will allow the default settings to show something reasonable as you create the element. This is only advise when starting out, these elements are fully vector graphics and may be drawn a large or small as desired.
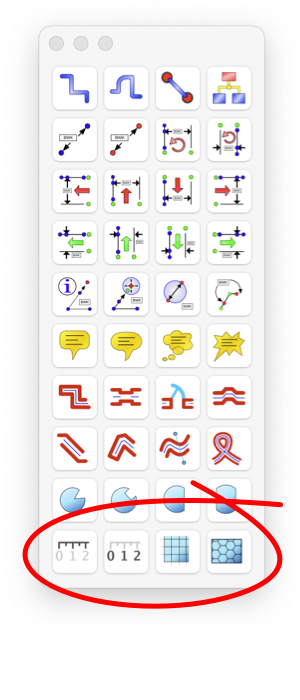
You will find the graphing and charting tools on the Technical tool palette that is accessed from the main View menu, menu selection "Technical".
|
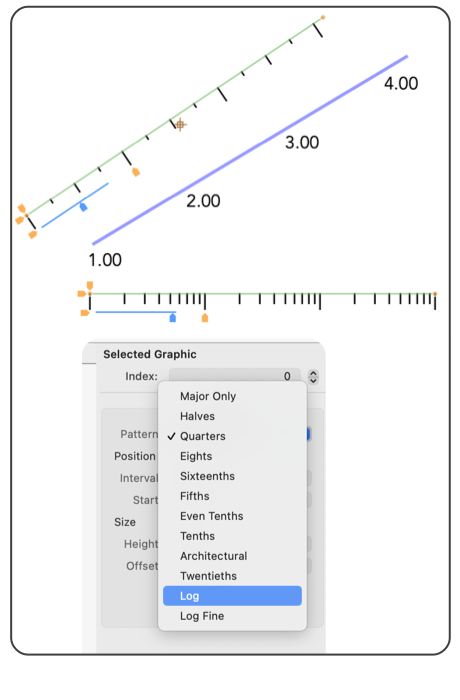
The left tool of this group is the Tick Mark tool. It draws a set of lines of varying length along a straight path. Handles are provided, when selected, to adjust the spacing, length and appearance of the tick-lines. Experimentation is the best way to learn all of the options available with this graphic. Be sure to adjust the purple interval handle, this is used to select the appearance of the tick-sequence. For example even-tenths, quarters, halves, an so on. Slide this tool away from the start of the sequence to access the logarithmic selections. Extend the "back side" of the tick to create half of a chart grid, associated precisely to the axis ticks.
The next tool is used to draw the labels or text / numeric portion of a chart axis. Simply click and drag out a line, the labels are drawn along this defining line. The numeric labels will follow a sequence, with a starting value and additive numeric interval. The sequence can be defined on-screen by double clicking the graphic and entering the standard text editing mode. More control of the sequence and appearance is provided on the
Graphic Details
Inspector. While this graphic initially appears very simple, the extended flexibility is actually quite significant: the full macOS typeface and font capability applies to these labels, static prefix and suffix text is allowed, and colored or stylized effects is used.
A Label Sequence may be adjusted on-screen. Click the Label Sequence once to select, you will note an additional text block appears. This text box has a number followed by a colon and a second number. The first is the starting numeric value, after the colon the step amount or delta value of the sequence is shown. This specifier text box behaves as a normal EazyDraw Text Box, double click it to enter the
editing
mode. In the on-screen editing mode you may edit both the starting value and the signed increment. The number of decimal places shown on your labels will mimic the number of decimal places that you include, use zeros if necessary to specify this. The typeface (font), size, color and other attributes of the text you enter for the starting number are mimicked in the labels. These need not be the same for full number, for example a smaller font size might be used after the decimal point. A prefix and/or suffix may be included - just type the desired text, for example the units of the values could be entered after the starting number, specifying it as a suffix.
While most aspects of the label sequence may be entered as edited text on screen, the somewhat cryptic nature of this technique is not necessary. Use the
Graphic Details
Inspector for a more descriptive interface to the full functionality of the label sequence.
The grid tool (third from left) is used to draw a rectangular grid as a single graphic element. Select the tool and draw a full rectangle, the grid is drawn in the enclosing rectangle. After it is drawn handles are provided to adjust the spacing and initial position of the grid. To adjust the spacing in a precise numerical fashion, use the Graphic Details Inspector.
The last tool is a Hex grid, formed with a set of interlocked equilateral-hexagons. These shapes are very symmetric, the radius is equal to a side length. After it is drawn, handles are provided to adjust several aspects of the grid. It may be orthogonal or oriented at an angle, the radius property is adjustable. The drawn length of each side is adjustable to obtain a hex-grid-tick appearance, or when extended fully this will provide an isosceles triangle grid.
|
As mentioned above, EazyDraw is not a charting application, so we are not providing a "canned" chart and there is no mechanism in EazyDraw to enter a table of date and automatically generate a graph or chart. Other applications are available for these tasks. The EazyDraw graphing tools can be used to enhance a graph or chart from another application, export the chart from the creating application as a PDF (save to file, or just drag and drop into EazyDraw). Leave your chart as a PDF, you may "ungroup" pdf with EazyDraw but that often leads to more complexity than is needed. Then you can use one of these charting components to draw-over, or along your imported chart-graphic. If necessary use "white-out" by placing a filled white rectangle over the portions of the imported chart that are not needed.
Notice that the Tick Mark tool provides a wide range of tick-mark-sequences, even logarithmic. Grids may be drawn using either the Grid tool or the Tick Mark graphic, extend the "back-side" of the tick marks to form half of a grid. This is useful when log-scales are needed, as the square grid tool does not have a log sequence pattern.
Two logarithmic tick sequences are provided. Slide the interactive tick sequence selector fully "away" from the start handle to access these sequences. The Graphic Details Inspector provides a popup menu to select the sequences by name, the two log sequences are found near the bottom of this menu.
Hex grids are provided primarily for "gamers" but the symmetry of the shape of the grid will provide many interesting designs.
Using these graphics, especially the Label graphic, will provide improved speed and drawing responsiveness. These complex elements are highly optimized by EazyDraw. One reason these were added to the EazyDraw tool suite was to simply improve speed. It was common to find hundreds of text elements in use when drawing charts. Each of these seemingly simple text blocks fully invoke the powerful typesetting machinery of macOS and this would place a significant load on the CPU and memory of the system. But with the use of these compound tools the typesetting, while still available, has been optimized to minimize the CPU load. - - They are just fast, it is as simple as that.
|